



A publisher connects an ad network, sets up zones, traffic is flowing — and eCPM is below expectations. This is the most common scenario I encounter at AdsCompass: a site with decent traffic volume earns 2–3 times less than it could because the monetization was configured "by default" and never touched again. The problem is almost never the traffic or the network — the problem is how exactly the zones, formats, and display frequency are organized. eCPM isn't a fixed rate that the advertiser pays. It's a results metric that reflects how effectively you're monetizing each thousand requests. And you can influence it without increasing traffic or switching networks. This guide covers specific actions, each of which raises eCPM, broken down by format and with honest tradeoffs that few people write about.
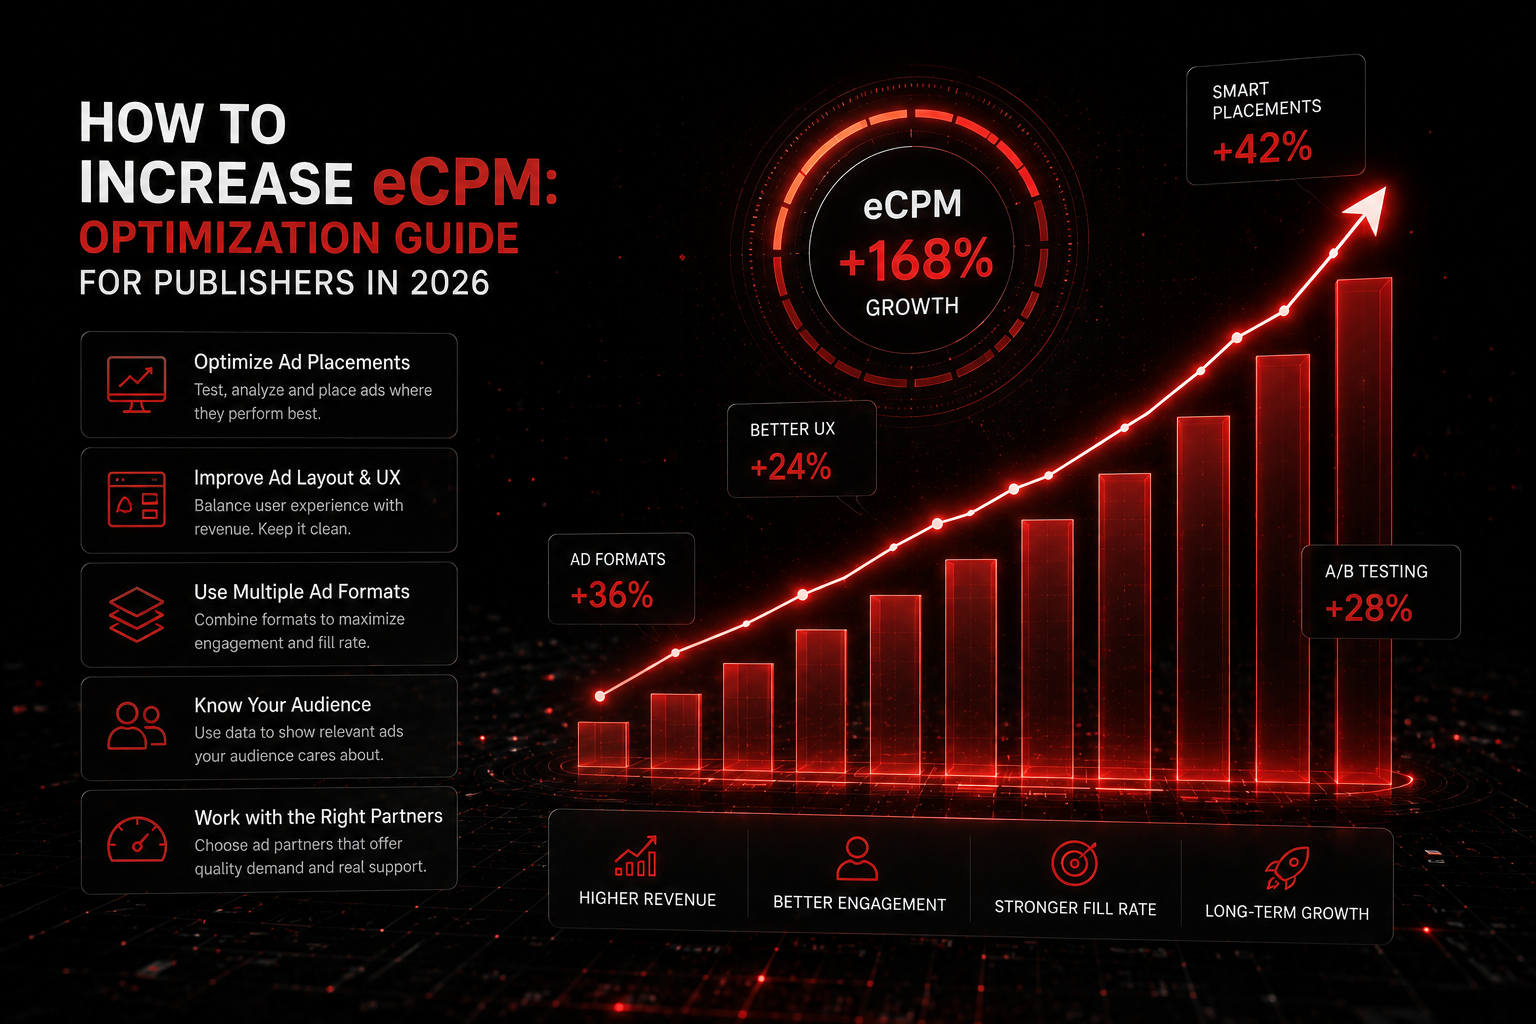
Key Takeaways
- Combining 2–3 formats increases overall eCPM by 30–50% without increasing traffic
- Splitting zones by GEO prevents eCPM dilution from cheap traffic
- Frequency caps reduce impression count but raise eCPM per impression
- High fill rate at low bids is worse than 80% fill rate at high bids
- Ad overload kills retention — and eCPM along with it

Why eCPM Is Low: Three Causes Publishers Miss
When a publisher complains about low eCPM, the first thing I check in their account isn't the rate — it's three specific parameters. First: all GEOs are lumped into a single zone. Tier-1 traffic from Germany and Tier-3 from Pakistan generate drastically different revenue, but if they're in one zone, statistics show an average, and Tier-1 advertisers won't pay a premium for diluted inventory. Second: only one format is running. A site with popunder but no in-page push loses revenue from the iOS audience and from users who don't click but engage with push-like formats. Third: no frequency cap, and the same user sees an ad on every click. Advertisers see low CR on the zone, lower their bids, eCPM drops. All three problems can be fixed in a day and require no additional traffic.
How Format Stacking Raises eCPM
Each ad format monetizes a different type of interaction. Pop earns on the transition to a new window. In-page push earns on visual contact with a notification inside the page. Native earns on a click to content that looks like part of the site. Banners earn on visibility in a fixed position. When only one format runs on a site, you're monetizing only one type of behavior. Adding a second format doesn't "steal" revenue from the first — it captures the audience segment that the first format doesn't serve.
Based on AdsCompass account data, adding in-page push to popunder raises overall zone eCPM by 30–50%. Adding banners on top of that gives another 10–15%. All AdsCompass formats are compatible with each other and don't conflict on the page when codes are installed correctly.
Honest tradeoff: more formats means more ad elements on the page. Overdo it, and the user leaves, retention drops, and with it the traffic that was generating revenue. The optimal stack for most sites is two to three formats, no more. Test adding each format separately and measure not just eCPM but also behavioral metrics: time on site, page depth, returning users.
How Splitting Zones by GEO Increases Revenue
This is the most underrated optimization technique — and the fastest to show results. When all of a site's traffic passes through a single zone, the ad network sees averaged inventory. A Tier-1 advertiser willing to pay $3 CPM for Germany won't compete for a zone where 70% of impressions go to Tier-3 at $0.20. The result: Tier-1 traffic sells at a discounted price, while Tier-3 doesn't move the needle because its share of revenue is minimal.
The solution: create separate zones for GEO groups. Minimum split — Tier-1, Tier-2, Tier-3. Advanced option — separate zones for key countries (US, Germany, UK) if they account for a significant share of traffic. On AdsCompass for publishers, zones are created in the self-serve dashboard, and eCPM and fill rate statistics are available in real time for each zone individually.
Honest tradeoff: more zones means more management work. For a site with traffic from 50 countries, creating 50 zones is overkill. The sweet spot: 3–5 zones grouping GEOs with similar eCPM.
How Frequency Caps Affect eCPM
A frequency cap limits how many times an ad is shown to a single user within a time period. Without a frequency cap, one visitor can see a popunder on every click on the site — 5, 10, 20 times per session. At first glance, that's more impressions and more revenue. In practice, it's the opposite.
Advertisers evaluate zones by CR: if 1,000 impressions on a zone produce 0 conversions because the same user saw the ad 20 times and never converted, the advertiser lowers their bid on that zone or excludes it. eCPM drops. A frequency cap of 1 impression per 24 hours per unique user increases zone CR, advertisers raise their bids, eCPM rises. The actual number of impressions decreases, but revenue per impression increases — and in most cases, total revenue ends up higher.
According to IAB, frequency control is part of baseline recommendations for ad inventory management. For popunder, the optimal cap is 1 impression per 12–24 hours. For in-page push: 2–3 impressions per day. For native and banners, capping is less critical, but overload still reduces viewability and engagement.
What Mistakes Lower eCPM and How to Fix Them
Beyond the three core issues described above, there are mistakes publishers make during the optimization phase itself — that is, when they're already trying to improve things.
First: chasing fill rate at the expense of rates. A 100% fill rate at 0.30 CPM is worse than an 80% fill rate at 1.00 CPM. eCPM in the first case: 0.30. In the second: 0.80. Sometimes it makes sense to leave some impressions unfilled rather than dilute eCPM with cheap ads.
Second: ignoring Core Web Vitals. Ad scripts affect page load speed. Google factors Page Experience into rankings, and a drop in search positions means a drop in organic traffic, which means a drop in revenue. A heavy ad code that adds 2–3 seconds of load time can cost you more than it earns.
Third: not updating the strategy. eCPM depends on seasonality, advertiser competition, and market conditions. Settings that worked in January may stop working in April. According to Statista, ad budgets are distributed unevenly throughout the year — Q4 traditionally delivers the highest eCPM, Q1 the lowest. Review zones and frequency caps at least once a quarter.
Fourth: not testing. "Adding in-page push" isn't optimization. Optimization is adding in-page push, measuring eCPM before and after, comparing behavioral metrics, and deciding based on data whether to keep the format or remove it. Without A/B testing, you don't know what's working and what's hurting.
How to Track and Optimize eCPM on AdsCompass
AdsCompass provides publishers with the tools that make each method described above actionable in practice. The self-serve dashboard lets you create separate zones for each format and GEO, set frequency caps, and track eCPM and fill rate in real time — with breakdowns by zone, format, GEO, device, and OS.
Direct demand from 6,500+ active advertisers ensures competition for inventory at auction, which keeps eCPM at a competitive level. A proprietary anti-fraud system filters invalid traffic on the platform side — protecting zone reputation with advertisers and preventing payout deductions. Available formats: pop, push, in-page, native, banners, video pre-roll, and Telegram Mini-App. Minimum payout is $50, with methods including PayPal, Crypto, Stripe, Paxum, WebMoney, and Wire Transfer.
Optimization algorithm: split zones by GEO → add a second format to the primary one → set frequency caps → allow 7–14 days for data collection → compare eCPM before and after → repeat the cycle.
FAQ
What eCPM is considered good?
It depends on format and GEO. Benchmarks for popunder: 2–4 in Tier-1, 0.20–0.80 in Tier-3. For push: 3–8 in Tier-1, 0.50–3.00 in Tier-3. For native: 1–5 in Tier-1. Compare your eCPM against these ranges and your own trends — a 10–15% increase after optimization is a solid result.
How often should I check eCPM?
At least weekly — to catch anomalies. A full strategy review (zones, formats, frequency caps) should happen quarterly. In Q4 (October–December), eCPM typically rises due to increased ad budgets; in Q1 (January–March), it drops.
Does anti-fraud affect eCPM?
Yes, positively. Anti-fraud filters out invalid traffic that lowers zone CR. Advertisers see cleaner statistics and are willing to pay more for verified inventory — eCPM rises. Short-term, impression volume may decrease, but revenue per impression increases.
Can I increase eCPM without increasing traffic?
Yes. Every method in this guide works with existing traffic: format stacking, GEO-based zone splitting, frequency caps, cleaning out invalid traffic. Traffic growth helps, but it's not a prerequisite for eCPM improvement.
What's the difference between eCPM and RPM?
eCPM is revenue per 1,000 ad impressions. RPM is revenue per 1,000 page views. A single page can contain multiple ad units, so RPM is typically higher than eCPM. For optimizing monetization in an ad network, focus on eCPM — it shows the effectiveness of specific zones and formats.
Should I connect multiple ad networks at the same time?
You can, and many publishers do. Multiple networks increase competition for inventory and raise fill rate. But make sure ad codes don't conflict and don't violate network policies. On AdsCompass, direct demand from 6,500+ advertisers already creates strong competition within a single platform.
About the Author
Vlada, Business Developer at AdsCompass. Works with advertisers and publishers in digital advertising, specializing in performance formats and international markets. Helps partners build traffic acquisition and monetization strategies across 200+ GEOs.