



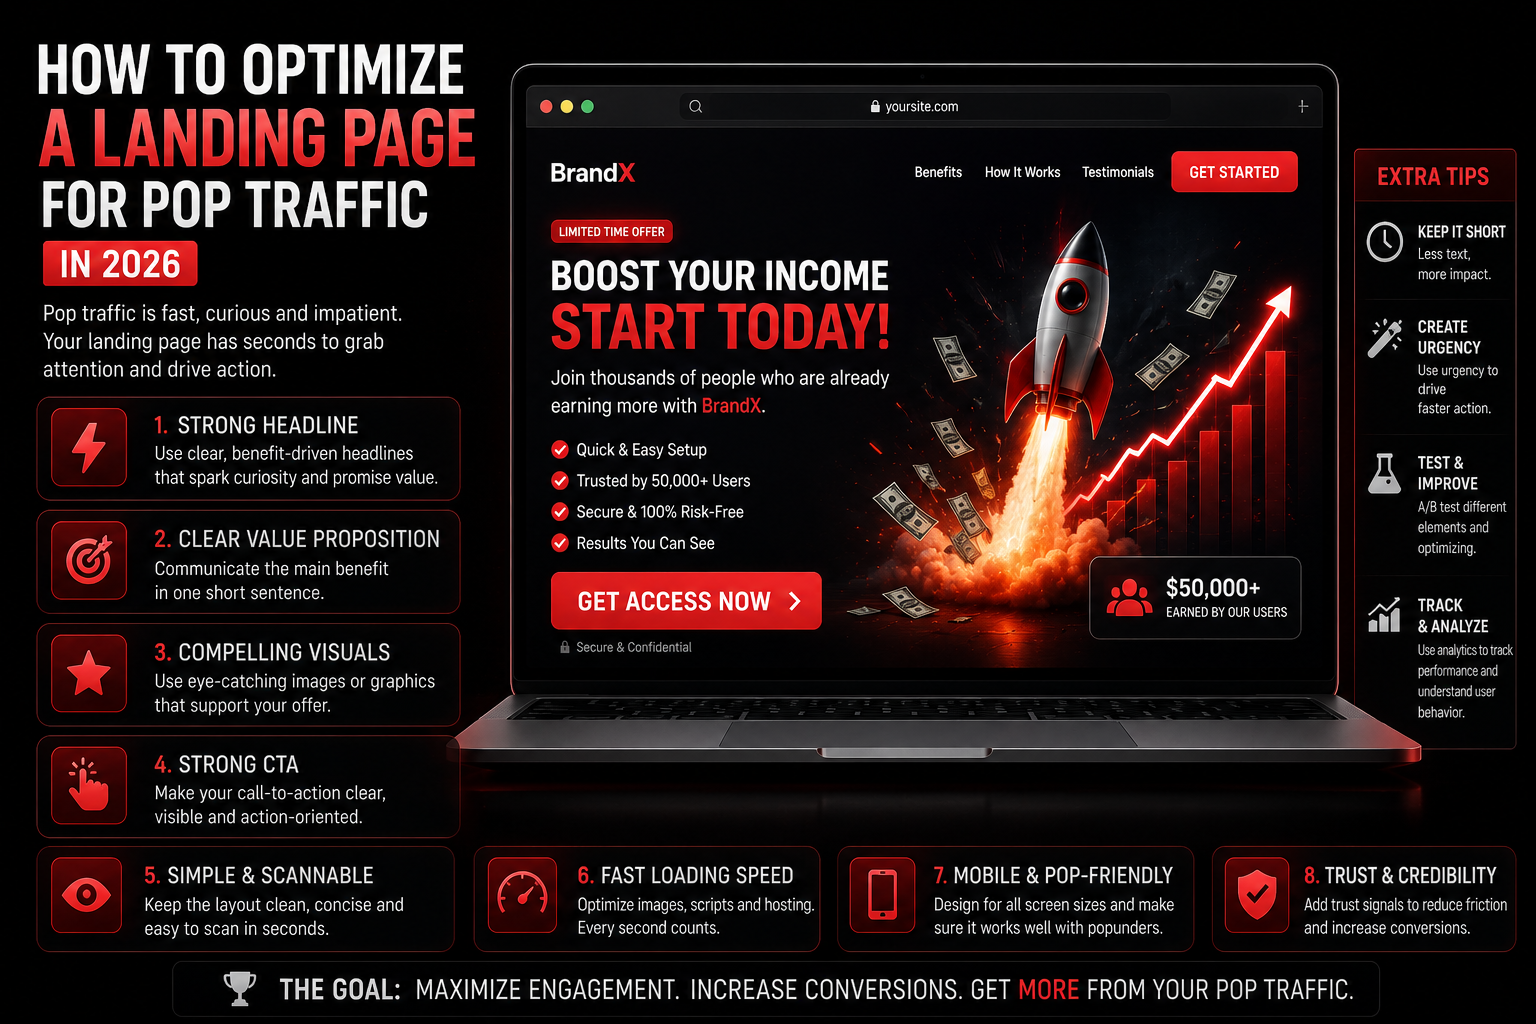
In push advertising, the creative is the headline and icon. In pop advertising, the creative is the landing page. The user doesn't see a banner, doesn't read a description, doesn't decide whether to click. The page opens automatically, and you have 2–3 seconds to hold attention. If the landing page loads slowly, looks irrelevant, or doesn't provide a clear CTA — the user closes the tab and the click is wasted. I see this daily at AdsCompass: two buyers purchase pop traffic from the same zones in the same GEO, at the same bid. One gets 2% CR, the other gets 0.1%. The difference is the landing page. The first loads in one second, has a prominent CTA, and is optimized for mobile. The second is a desktop page with a 5-second load time and tiny text on a mobile screen. This guide covers specific rules for every landing page element, with metrics, honest tradeoffs, and a mobile vs desktop breakdown.
Key Takeaways
- For pop, the landing page IS the creative: it's the first and only contact with the user
- Load speed under 2–3 seconds is a critical requirement — each second costs –20% of the audience
- Above the fold: headline + offer + CTA — everything needed for conversion, no scrolling
- A pre-lander increases engagement but loses 30–50% of traffic on the additional step
- Mobile and desktop landing pages are two different products, not an "adaptive version"
Why the Landing Page IS the Creative for Pop Traffic
Unlike push, native, or banners, the pop format has no intermediate creative element. No headline that attracts attention. No icon that stops the eye. The user clicks on the publisher's site, and your page opens in a new window or tab — instantly, without warning. This means the landing page performs all creative functions simultaneously: capturing attention, conveying the offer, building trust, and converting. On AdsCompass, pop runs on CPC — you pay for each click, and each click brings the user to your landing page. If the landing page doesn't convert, you're paying for visits that generate nothing. The landing page CR for pop traffic directly determines cost per conversion and campaign ROI. According to Statista, mobile traffic accounts for 60–90% of total volume in Tier-2/3 — and for pop, this means your landing page will predominantly open on a mobile screen where space is limited and every element carries weight.
How Fast Should the Page Load and Why It's Critical
Load speed is the first filter between click and conversion. A pop traffic user didn't choose your page — it opened on its own. They have no motivation to wait. Industry data shows that each additional second of load time reduces conversion by 20%. A landing page that takes 5 seconds to load loses 60% of the audience before they see the content. For pop traffic, the critical threshold is 2–3 seconds. On mobile devices in Tier-2/3, where internet speeds are lower, this threshold is even tighter: 1.5–2 seconds.
What to do in practice: minimize page weight. No heavy frameworks, unoptimized images, or third-party scripts blocking render. Images in WebP format, compressed to 50–100 KB. JavaScript — only critical, loaded asynchronously. CSS — inline for above-the-fold content. Check speed through Google PageSpeed Insights — benchmark: Performance score above 80 for the mobile version. Google factors Page Experience into rankings, but for a pop landing page SEO is secondary — what matters is that the page loads before the user closes the tab.
Honest tradeoff: an ultra-light page loads instantly, but a "bare" landing page without visuals and content doesn't build trust and doesn't convert. The balance: minimum elements, but every element works toward conversion.
How to Structure the Landing Page: What Must Be Above the Fold
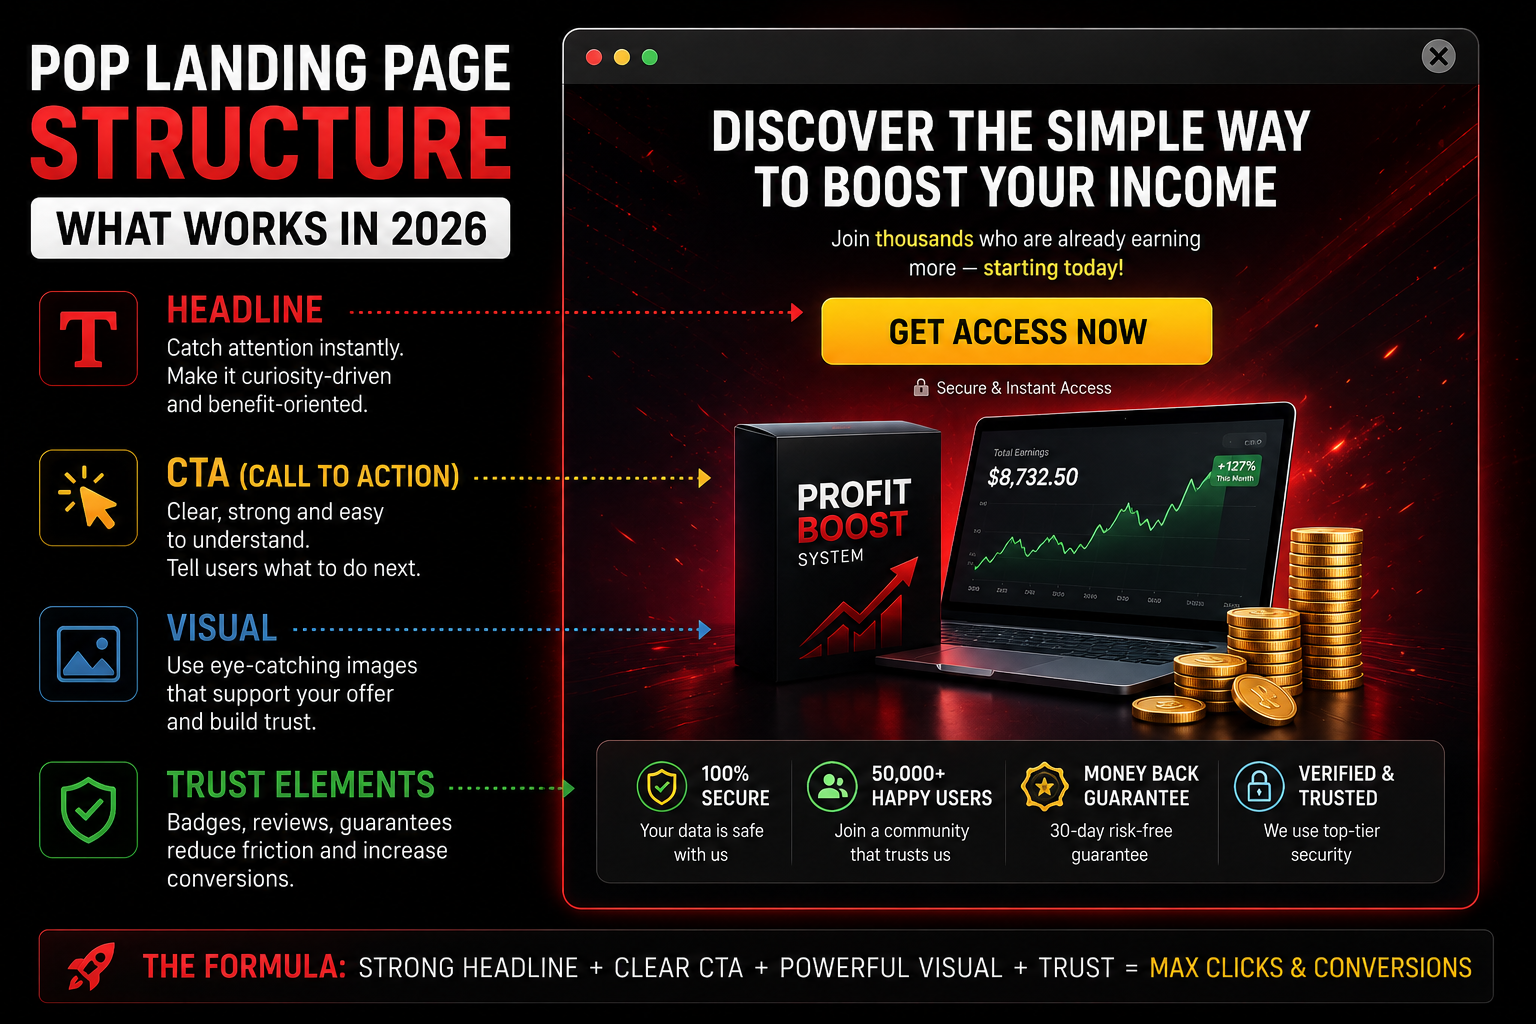
Above the fold is the part of the page the user sees without scrolling. For pop traffic, this is the only part that matters: 70–80% of users don't scroll. Everything needed for conversion must be visible immediately. The rule for a pop landing page: if the user can't understand the offer and tap the CTA without scrolling, the landing page will fail. This doesn't mean you can't place content below the fold. You can — for users who need more information. But the conversion path must close above the fold.
Headline and Offer
The headline is the first thing that registers. It should be short (5–8 words), specific, and contain a benefit. "Get a $50 Bonus" is stronger than "Welcome to Our Platform." The offer must be understandable in 1–2 seconds: what the user gets and what's required of them. No abstractions, no "the best offer for you." Specifics: amount, percentage, deadline, condition.
CTA Element
The CTA (Call to Action) is the single button that leads to conversion. It must be large (minimum 44×44 pixels for mobile touch targets), contrast against the background, and contain an action verb: "Claim Bonus," "Start," "Get." Not "Learn More" — that's not a converting CTA for pop traffic where the user didn't choose your content. One CTA per screen. Two CTAs mean competing for attention and lower CR.
Visual and Trust
One relevant image is more powerful than three abstract ones. For gaming — a game screenshot. For finance — a sum visualization. For sweepstakes — a prize image. Trust is built through elements that don't require reading: a logo, a rating, a user counter. With pop traffic, you don't have time to "build a relationship" — trust is either read visually in one second, or it doesn't exist.
Do You Need a Pre-Lander for Pop Traffic?
A pre-lander is an intermediate page between the pop click and the main landing page. Typically it's a simple page with a single question or interactive element (quiz, spin wheel, survey) that "warms up" the user before the main offer. A pre-lander solves a problem the main landing page can't: it filters the audience. A user who completes the pre-lander is more engaged and converts better on the main page. Main landing page CR after a pre-lander is typically 2–3 times higher than with a direct transition.
Honest tradeoff: a pre-lander loses 30–50% of traffic on the additional step. Out of 1,000 pop clicks, all 1,000 reach the pre-lander, but only 500–700 proceed to the main landing page. The question is math: if the main landing page CR after the pre-lander rises from 1% to 3%, then 700 × 3% = 21 conversions is better than 1,000 × 1% = 10 conversions. But if the pre-lander is weak and CR doesn't increase, you've simply lost 30–50% of traffic.
Recommendation: test both options. Launch one campaign with a direct link to the landing page, another with a pre-lander. After 48 hours, compare cost-per-conversion. On AdsCompass, both campaigns can be launched in parallel on the same zones and results compared in the tracker.
Mobile Landing Page vs Desktop: Key Differences
Mobile and desktop landing pages for pop traffic are two different products. Not "responsive design" where elements rearrange automatically, but two separate pages with different structures, different content, and different CTAs.
Mobile landing page: screen 320–420 pixels wide. Headline — 3–5 words (longer gets truncated or wraps). CTA button — full screen width. One image, no horizontal layouts. Minimal text — the mobile user doesn't read, they scan. Load time — under 2 seconds on 3G/4G.
Desktop landing page: screen 1200+ pixels. More content is acceptable, horizontal layouts, multiple visual elements. CTA button — large but not full width. Text is allowed but structured: subheadings, bullets, highlights.
In Tier-2/3, where 85–90% of pop traffic is mobile Android, a desktop landing page is effectively unnecessary. In Tier-1, where the balance is closer to 50/50, both versions are needed. On AdsCompass, campaigns can be targeted by device separately and directed to different URLs.
What Mistakes Kill Conversion on Pop Landing Pages
The first: a heavy page. A 2+ MB landing page with unoptimized images and three JS frameworks is a guaranteed loss of 50%+ users during loading. Every kilobyte costs conversions.
The second: CTA below the fold. If the user has to scroll to see the button, 70–80% won't reach it. The CTA must be visible on first page open.
The third: a desktop landing page on mobile. Tiny text, horizontal layout, a 20×20 pixel button impossible to tap with a finger. Mobile pop traffic with a desktop landing page is money thrown away.
The fourth: non-localized content. English text for a Brazilian audience. Dollar amounts for Indonesia. European faces in imagery for South Asia. Localization isn't translation — it's adapting visuals, currency, and context.
The fifth: multiple CTAs. Two buttons on screen means competing for attention means lower CR. One screen — one CTA. If different actions are needed, separate them into steps, not parallel options.
How to Test Landing Pages When Working with AdsCompass
Testing landing pages for pop traffic follows the same logic as testing push creatives: launch several variations, collect data, keep the winner. Minimum 2–3 landing page variations per test. Variations should differ by one element: headline, CTA, visual, or pre-lander presence. If you change everything at once, understanding what affected CR is impossible.
Data threshold: minimum 500 clicks per landing page variation. Pop traffic is cheap — at 0.001–0.01 CPC, that's 0.50–5 per variation. After collecting data, compare CR and cost-per-conversion. Keep the winner, disable the underperformers.
On AdsCompass, pop campaigns launch through the self-serve dashboard with targeting by GEO, device, and OS. Through S2S postback and subID (zone_id) in the tracker, you see each landing page's CR per zone — and can build white/black-lists not just by zone but by the "zone + landing page" combination. More details on tracking setup and zone management are available on the AdsCompass blog. For publishers, quality advertiser landing pages mean higher CR on zones, which attracts more demand and raises eCPM. To get started — sign up and launch your first test.
FAQ
What bounce rate is normal for pop traffic?
60–75% is the working range. Pop traffic is "cold": the user didn't choose your page, so bounce rate is higher than with push or native. A bounce rate above 85% signals problems: slow loading, irrelevant content, or GEO mismatch.
Short or long landing page — which converts better?
For pop — short. 70–80% of users don't scroll. Everything needed for conversion should be above the fold. A long landing page makes sense only for complex offers (finance, insurance) where the user needs more information to decide — but even then, the CTA must be visible without scrolling.
Is HTTPS required for the landing page?
Yes. Chrome and Firefox browsers mark HTTP pages as "not secure," which reduces trust and can block content rendering. HTTPS is a baseline requirement for any landing page in 2026.
How do I check landing page load speed?
Google PageSpeed Insights (pagespeed.web.dev) is a free tool that shows load speed and optimization recommendations. Test the mobile version: benchmark is a Performance score above 80, First Contentful Paint (FCP) under 1.5 seconds.
How many landing pages should I test simultaneously?
2–3 variations is optimal. Each needs at least 500 clicks for a statistically meaningful comparison. At 0.005 CPC, that's 2.50 per variation — affordable even on a minimal budget. More than 4 variations slows down data collection.
Can I use one landing page for different GEOs?
Not recommended. Language, currency, visuals, and internet speed all differ. A landing page for Germany (desktop, fast internet, euros) and for Indonesia (mobile, 3G/4G, rupees) are two different products. Minimum localization: text translation, currency adaptation, mobile optimization for Tier-2/3.
About the Author
Vlada, Business Developer at AdsCompass. Works with advertisers and publishers in digital advertising, specializing in performance formats and international markets. Helps partners build traffic acquisition and monetization strategies across 200+ GEOs.